

Everyone has a love/hate relationship with attribution. Mostly hate. I was the CMO of Branch and I built a multi-touch model there that was directionally useful, not truly right. It over-credited what was easy to measure (late-stage clicks, form fills and email) and under-credited what actually created the deal (content, referrals, events, the dark funnel). For the past two years at Upside we’ve been building the data layer to fix that, and a few months ago Alex Bauer (Branch early employee, now my co-founder at Upside) built something on top of it that I think is truly new: an attribution engine that runs a panel of independent LLM analysts on every deal, argues with itself, and produces a zero-sum credit allocation where every dollar is accounted for.
This post is the technical overview of how it works. The part that most marketers will be surprised by, but eventually agree with: demo request forms (and all form fills and customer actions) get exactly 0% credit. I’ll get to why.
Why B2B attribution was never actually solved
One thing I have learned while working on attribution at Upside and at Branch is that there is no attribution model that can be applied to every problem. The tagline “all models are wrong, but some are useful” applies to attribution models, and most of what this article explores is the concept of applying a zero-sum credit allocation to the activities that led to sourcing a complex B2B deal.
The market currently agrees that there is no accurate model to solve this and instead uses time-based heuristics: first-touch, last-touch, U-shape, W-shape. These are just weighting curves over timestamps. The first or last touchpoint might not matter at all, but the curve doesn’t know that, because the curve doesn’t read the emails.
Our thesis is that finding a more accurate B2B attribution model failed for two reasons, and neither of them is “attribution is conceptually impossible”:
- The data was never complete enough. A huge fraction of what creates pipeline (a coffee meeting, a peer referral, someone seeing your billboard) never becomes a CRM record.
- B2B has the worst possible shape for statistical modeling. Thousands of touchpoints per deal, and a limited number of deals. You cannot fit a credible causal model on 40 deals with 2,000 touchpoints each; there is not enough signal to get a statistically accurate causality model. Some companies like Paramark are tackling this problem, but they only do it for actions that have significant volume and distinct touchpoints, like ads, not the whole deal.
Prerequisite: 24 months of unglamorous data work
The first version of an attribution model was a more complex weighted model — give weights to all the touchpoints involved based on rules: emails take less effort and should get less weight than webinars.
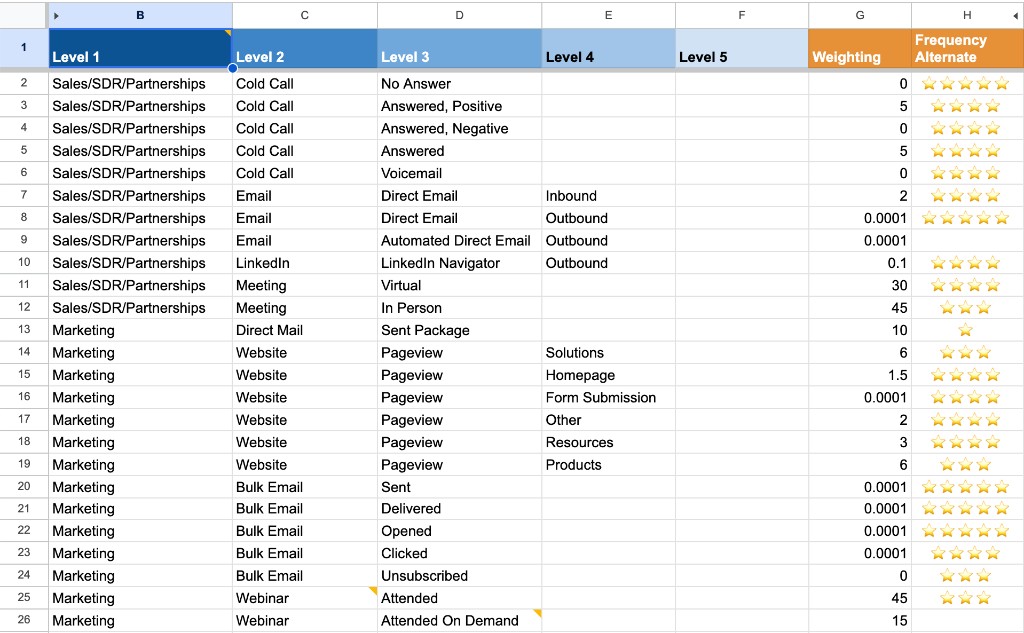
To know if this kind of model was right we decided to manually look at hundreds of complex customer deals ($1M+) and understand what actually drove them. We found two things:
- There were many touchpoints that were mostly irrelevant — many marketing and sales emails, sometimes other marketing touchpoints that never led to any real engagement.
- The real story was sometimes found inside unstructured data: email forwards that were never logged, SFDC call notes, call transcripts. But finding it felt like forensic digging — sometimes two of us would look at the same deal and only one would find a buried relevant touchpoint. Someone was referred by an existing customer or a partner and mentioned it on a call, but they showed up as a direct website visit. Someone attended an event and asked for a demo after but never registered, so the demo form was getting all the credit.
In most cases the real story of the deal was completely different from what an attribution model showed, because any model would only look at structured data.
So before any of the interesting agent stuff, we spent about two years building the boring part: pulling CRM, email, calendar, call transcripts, and web activity into one place, then healing it. Identity resolution (the same person with two emails across two systems becomes one person), buying group detection, activity deduplication across systems, and extracting touchpoints that only exist inside unstructured text. The output is an account-level timeline that is the cleanest, most complete version of “what happened” we can reconstruct.
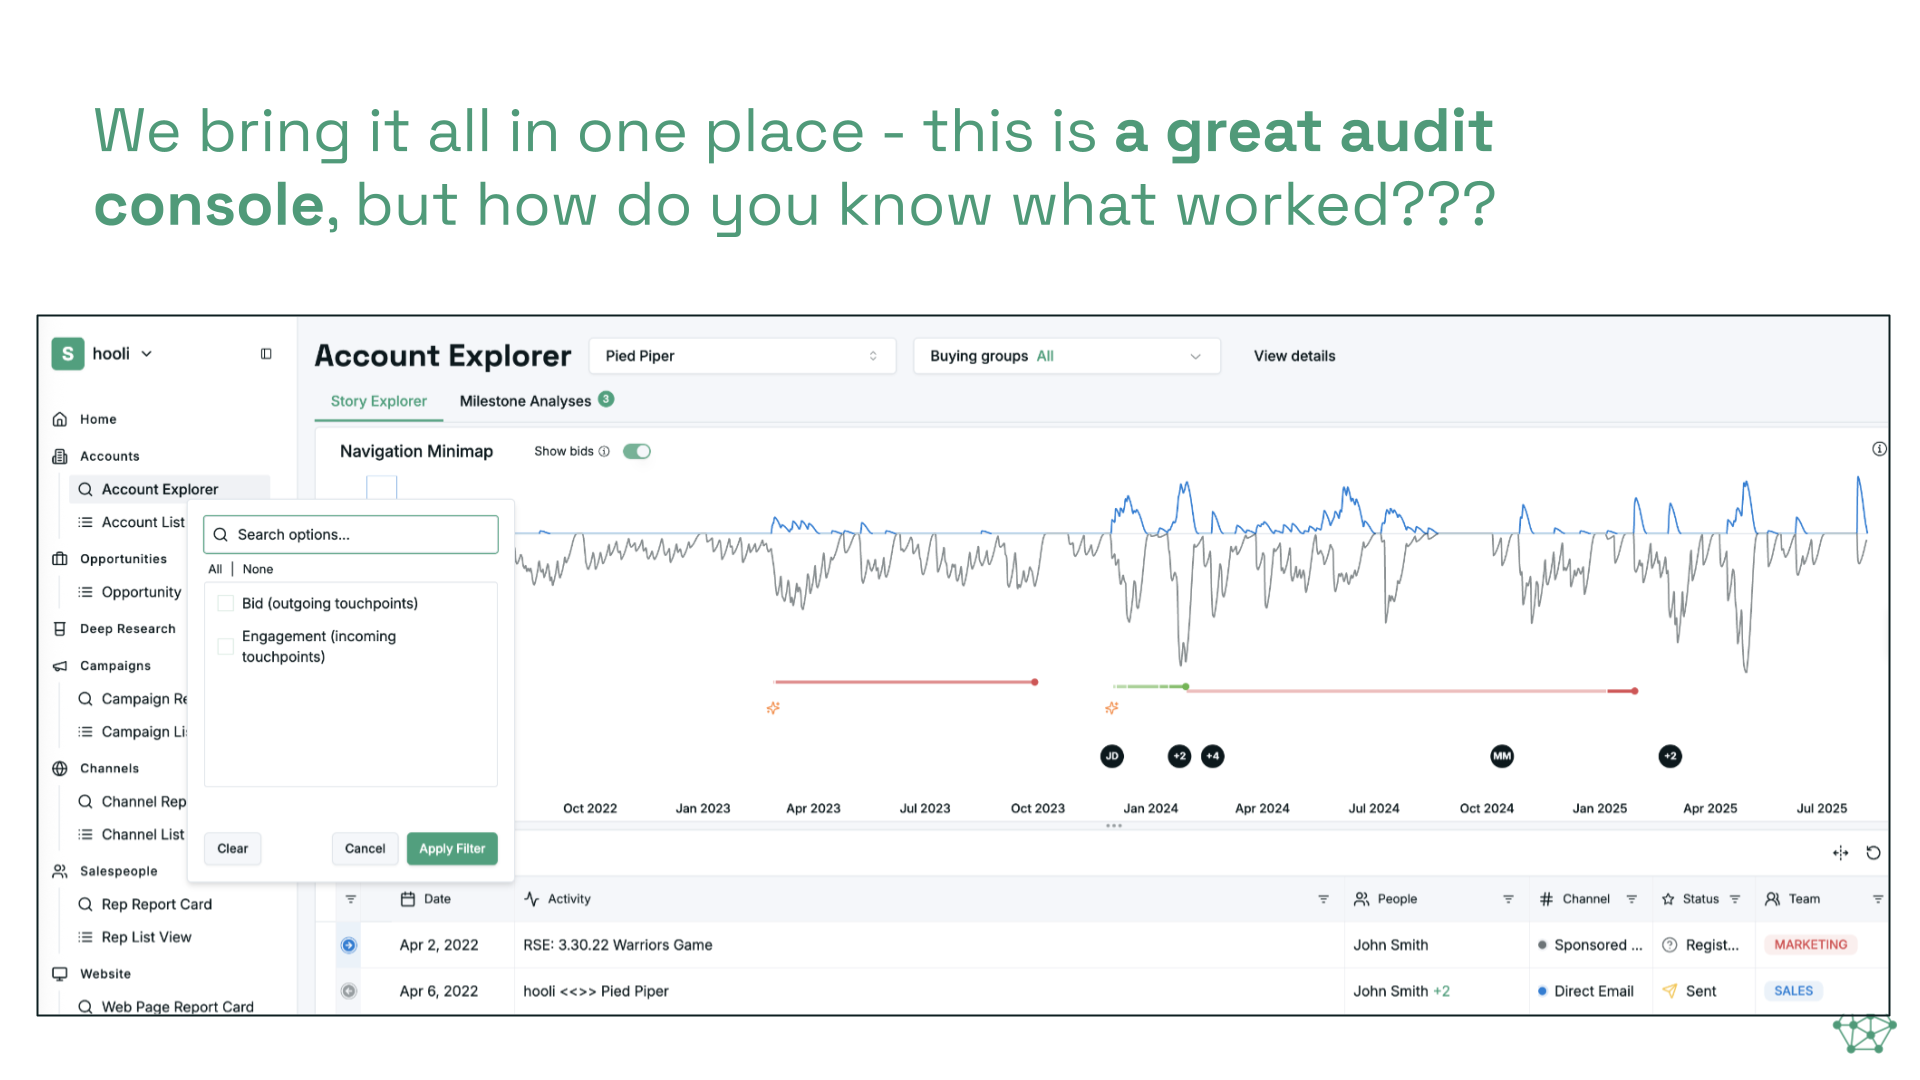
That gets you a great audit console but does not tell you what worked. Some of our customers’ deals run 18+ months with thousands and even tens of thousands of touchpoints. Knowing everything that happened just makes the credit question harder.
The core idea: attribution as evidence reasoning, not curve fitting
Alex’s insight was that we already had an intelligence layer that agents use to query this data, and now we could use AI to replicate the human logic we did in the early days. So instead of fitting a model, what if we made AI agents do what a smart human analyst does: read the whole deal, reason about causality, and defend a credit allocation with citations?
That required building a real domain theory first, because “just ask the LLM” produces vibes, not attribution. The theory lives in two prompt documents every agent reads: a commander’s intent (what we’re building, for whom, and the governing principles) and structural rules (the mechanics). Our main concepts:
Bids, responses, and cobids
Every discrete action on a deal timeline is one of three things:
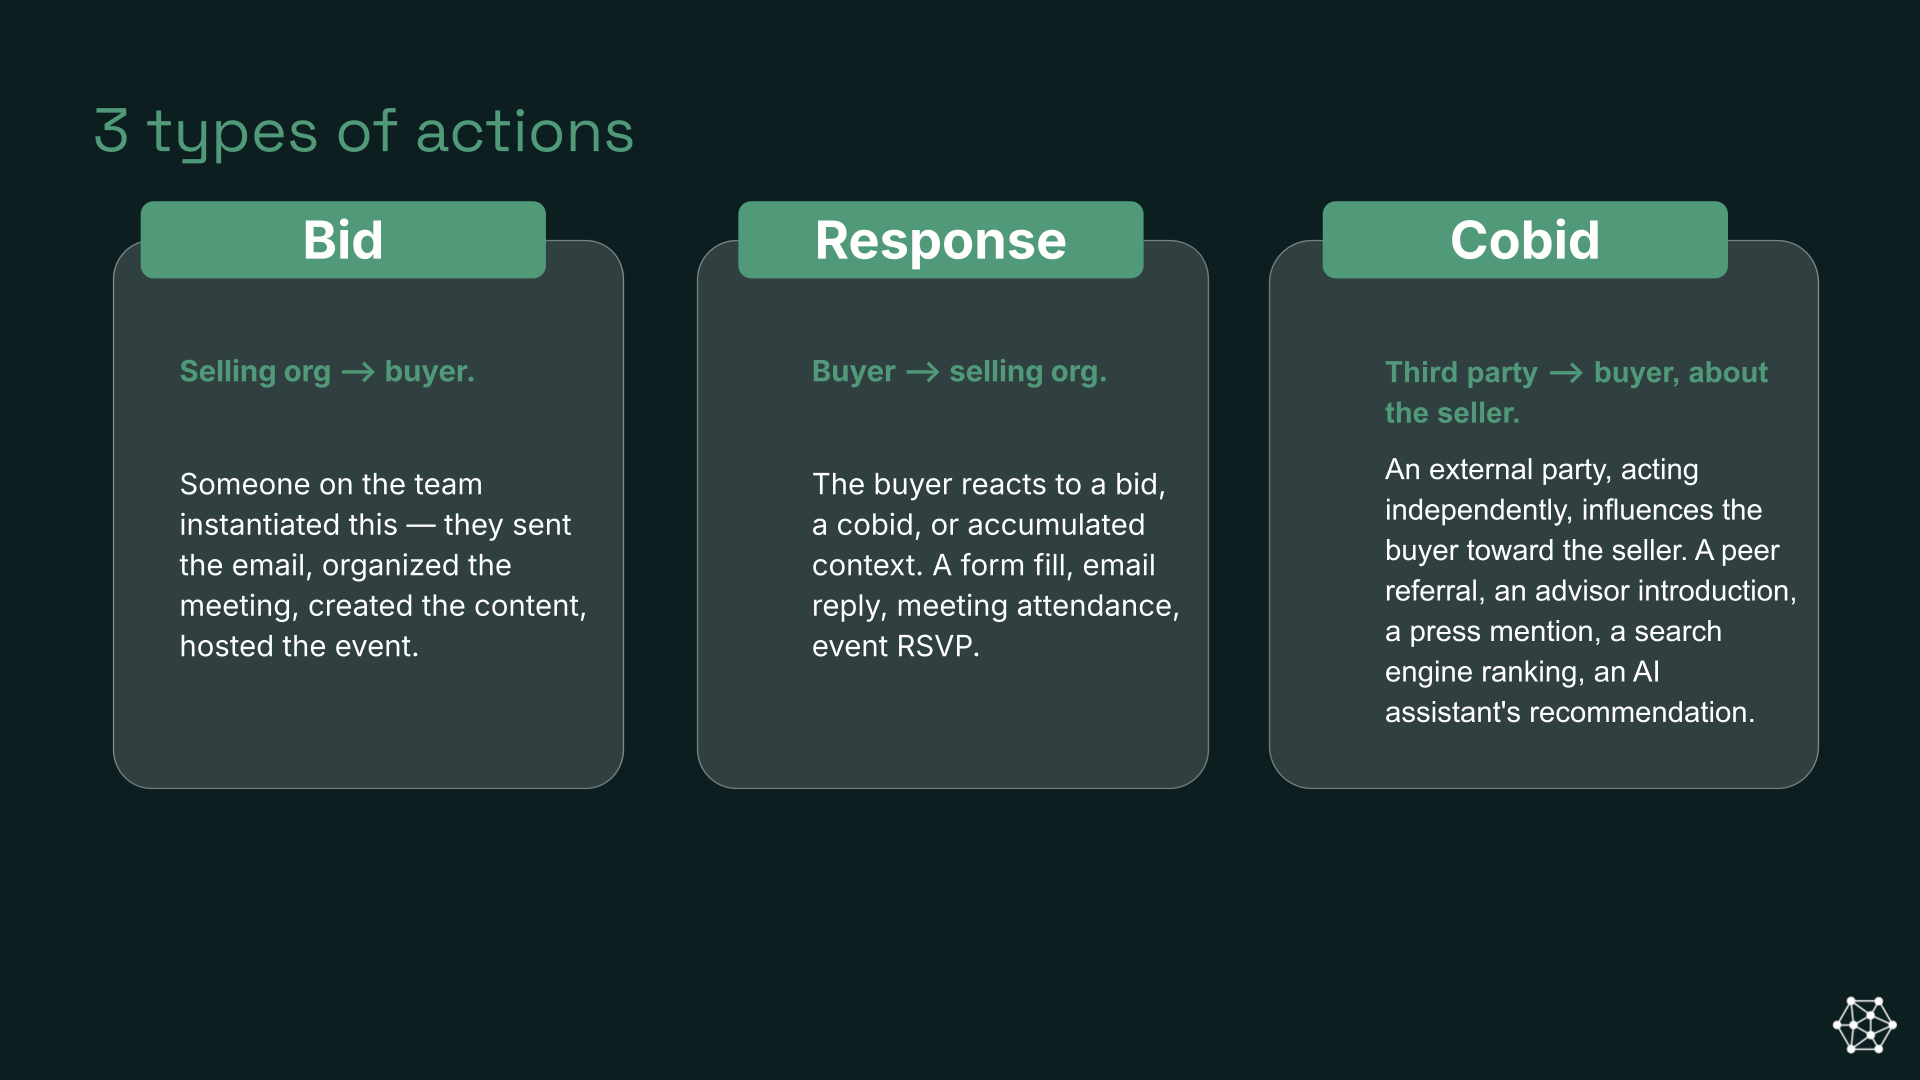
- Bid: selling org → buyer. Someone on your team instantiated it. Sent the email, organized the meeting, wrote the blog post, hosted the event.
- Response: buyer → selling org. A form fill, an email reply, meeting attendance.
- Cobid: third party → buyer, about you. A peer referral, an advisor intro, a press mention, a search ranking, a ChatGPT recommendation. You didn’t orchestrate it (if you did, it’s a bid).
The rule that everything else is based on, which can be quite controversial: credit belongs to whoever instantiated the thing, not to the buyer’s observable reaction to it. Responses always carry 0% credit. They are evidence that something worked, not the thing that worked.
This is why the demo request gets zero. From the buyer’s perspective, the demo request form is the annoying thing they have to get through to talk to someone about buying. It did nothing to convince them. If anything it was friction. Instead, everything that led them to be convinced enough to fill it out is what deserves the credit. Most attribution models we’ve seen, including the one I built at Branch, hand form fills 20% of the deal. Then leadership reads the report and concludes the growth strategy is “more forms.”
And if we can’t see anything before the demo request? What happened after doesn’t get more credit — instead the pool of circumstantial influence gets the credit, more on that below.
The 0% rule is also a structural constraint, not just philosophy: in our classification hierarchy, bids roll up through the selling org branch (team → person → channel → campaign → engagement) and cobids through the third-party branch (entity type → actor). A response with non-zero credit belongs to neither branch and shows up as “Unassigned” in every rollup. Making responses 0% keeps the whole reporting tree zero-sum and aggregatable.
Direct, extracted, inferred
Touchpoints come in three evidence classes:
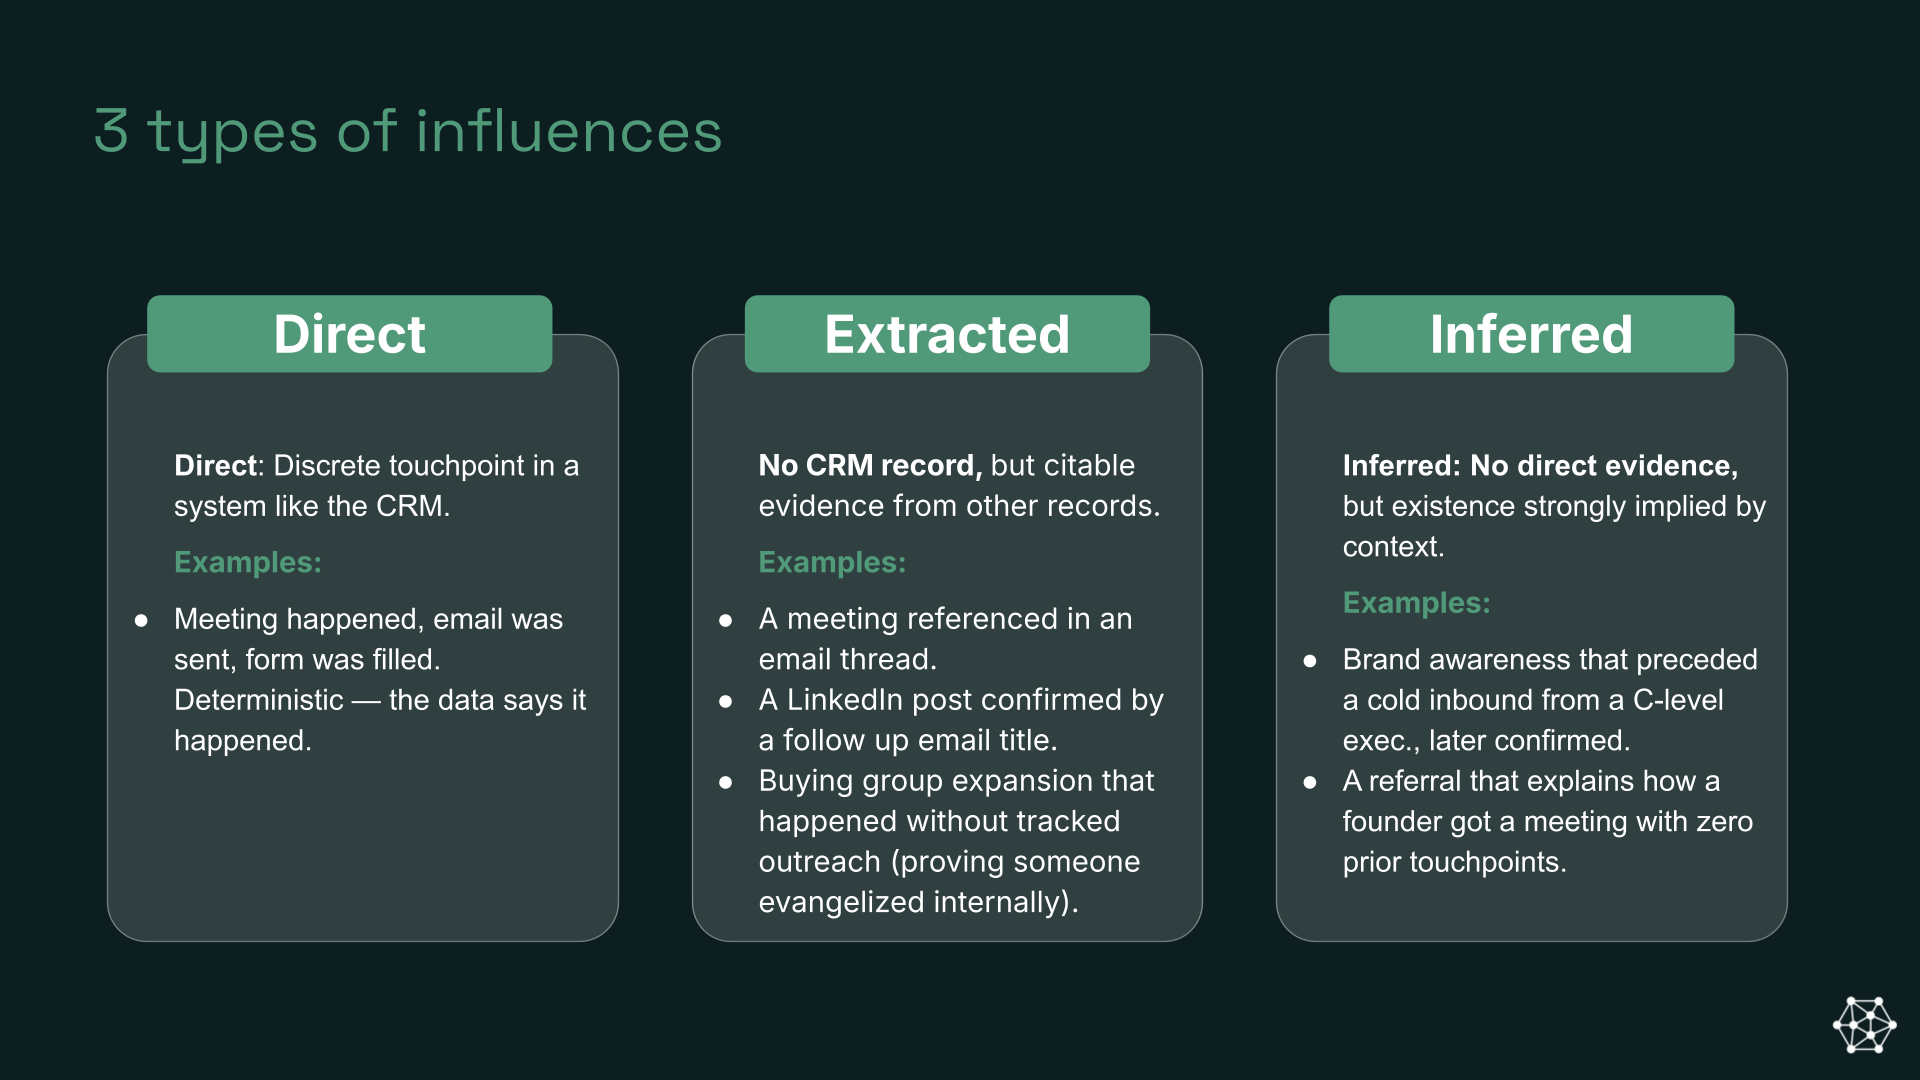
- Direct: a CRM record exists. Deterministic.
- Extracted: no CRM record, but citable evidence in other records. “Great meeting you for coffee yesterday” in an email thread means a meeting happened that nobody logged. A customer saying “I’ve been seeing your billboards” on a call means the billboard mattered. These get held to the same quality bar as tracked touchpoints; they simply weren’t tracked.
- Inferred: no direct evidence, but existence strongly implied by context. A cold inbound from a C-level exec implies brand awareness got built somewhere.
The pool: uncertainty as a first-class output
Direct and extracted touchpoints each get a specific credit percentage. The remainder goes into a pool of circumstantial influence, broken into named, explicitly probabilistic subdivisions (organizational readiness, internal champion relay, brand awareness, and so on). The pool is not a hedge, but a specific claim about invisible influence, and its size is computed from signal coverage:
- If most tracked activity is inbound with few outbound actions, the outbound bids must be happening somewhere invisible. Bigger pool.
- A 6-month gap with zero activity followed by immediate re-engagement means something sustained the relationship through the gap. Bigger pool.
- 25 touchpoints over 14 months with a coherent story from first engagement to hand-raise. Small pool.
A deal with a 10% pool has great CRM coverage. A deal with a 65% pool is telling you that most of your pipeline creation is invisible to your systems, which is itself one of the most useful things a CMO can learn.
The architecture: jury, judge, and two skeptics
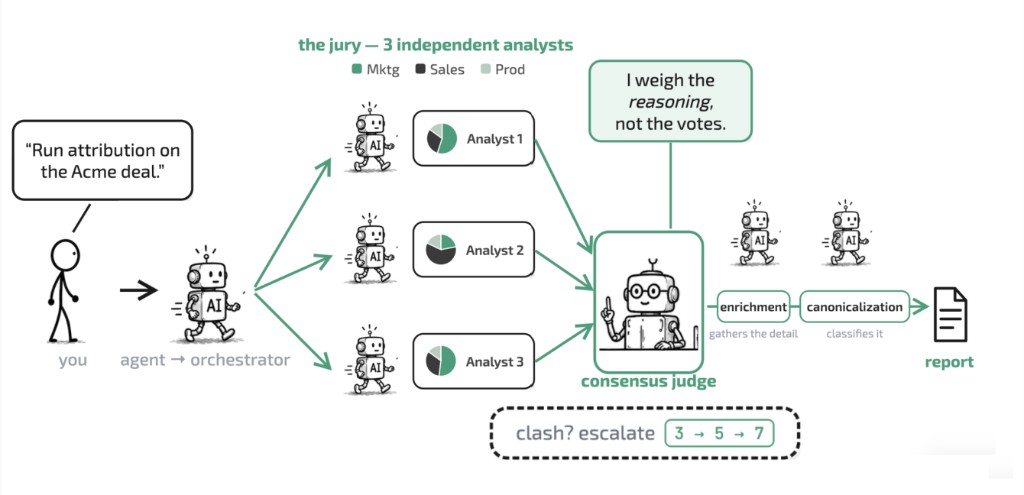
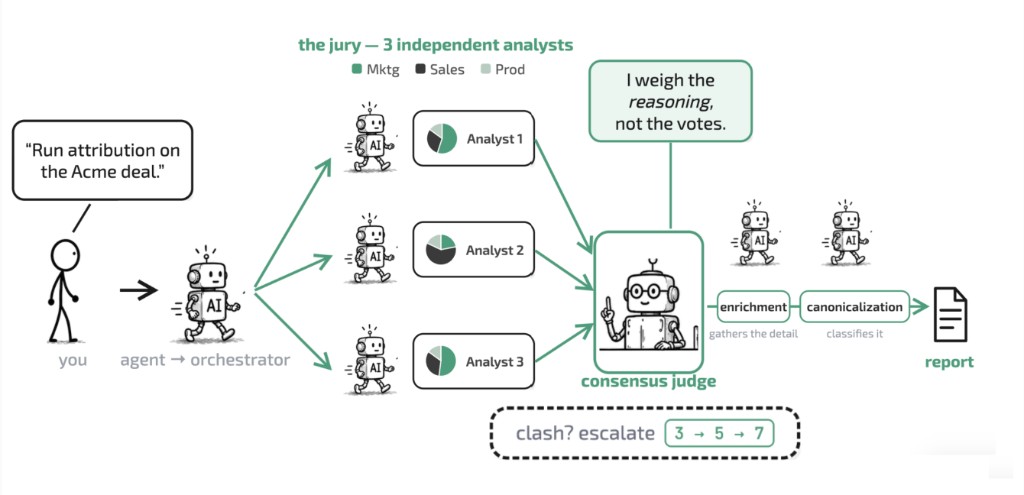
A run starts with “run attribution on the Acme deal.” An orchestrator dispatches three independent analyst agents. Each is an Opus-tier model with the same CRM query tools and the same instructions, running up to an hour. They are not assigned different angles on purpose. The point is that three equally capable analysts looking at the same messy deal will not reach identical conclusions, same as three skilled humans wouldn’t. Each one’s primary obligation is traceability: every claim needs citations (record IDs, transcript quotes, email references) a downstream agent can verify.
Their outputs go to a consensus judge. The judge weighs the reasoning, not the votes. A year ago Alex and I were doing this manually, disagreeing about deals and arguing it out, and the judge behaves the way we did: where the runs agree, follow. Where they disagree, evaluate why. A minority run that noticed evidence the others missed can override the majority, but overriding requires explicit reasoning. We deliberately rejected majority vote and median-of-three, because the entire value of the system is contextual reasoning, and mechanical aggregation throws that away. When the spread is too wide to adjudicate, the judge escalates: 3 analysts → 5 → 7.
(Why start at three? Cost. Each analyst is an expensive model running up to an hour. On a straightforward deal, five analysts agree the same way three do, just slower and pricier.)
Then two more agents that exist mostly to be skeptical:
- Enrichment attaches full CRM data to every touchpoint in the consensus. Its instruction is to over-query rather than under-query. It also holds veto power: if the consensus contains a citation to a record that doesn’t exist, it rejects the whole deal back to re-analysis. This is our hallucination firewall.
- Canonicalization maps every touchpoint onto a per-customer classification tree and influence taxonomy, so results aggregate across deals. Its bar for every dimension value is what we call the rollup test: “would a GTM leader reading a report grouped by this dimension find this value useful and truthful?” It has the same veto power.
One prompt-design principle runs through all of them, straight from the structural rules doc: exhaust before escaping. Every agent has fallbacks (a classification path can stop at team level, a source can be “unknown”) but using one requires documenting what you tried first. A short path means you looked everywhere and truly could not resolve deeper, not that it was hard and you moved on. Agent time is cheap; a misleading value in a CMO’s report is not. Relatedly, we made classification paths variable-depth with explicit null gaps, because “we know the team and channel but not the person” is a more trustworthy statement than a fabricated person name, and downstream consumers can see exactly where knowledge stops.
What comes out the other end
Per deal, two outputs: a zero-sum multi-touch allocation across all identified influences, and an opportunity source (the system distinguishes the hand-raise, the buyer’s decision moment, from the source, the upstream event whose removal would have broken the causal chain). Here’s a real (anonymized) deal:
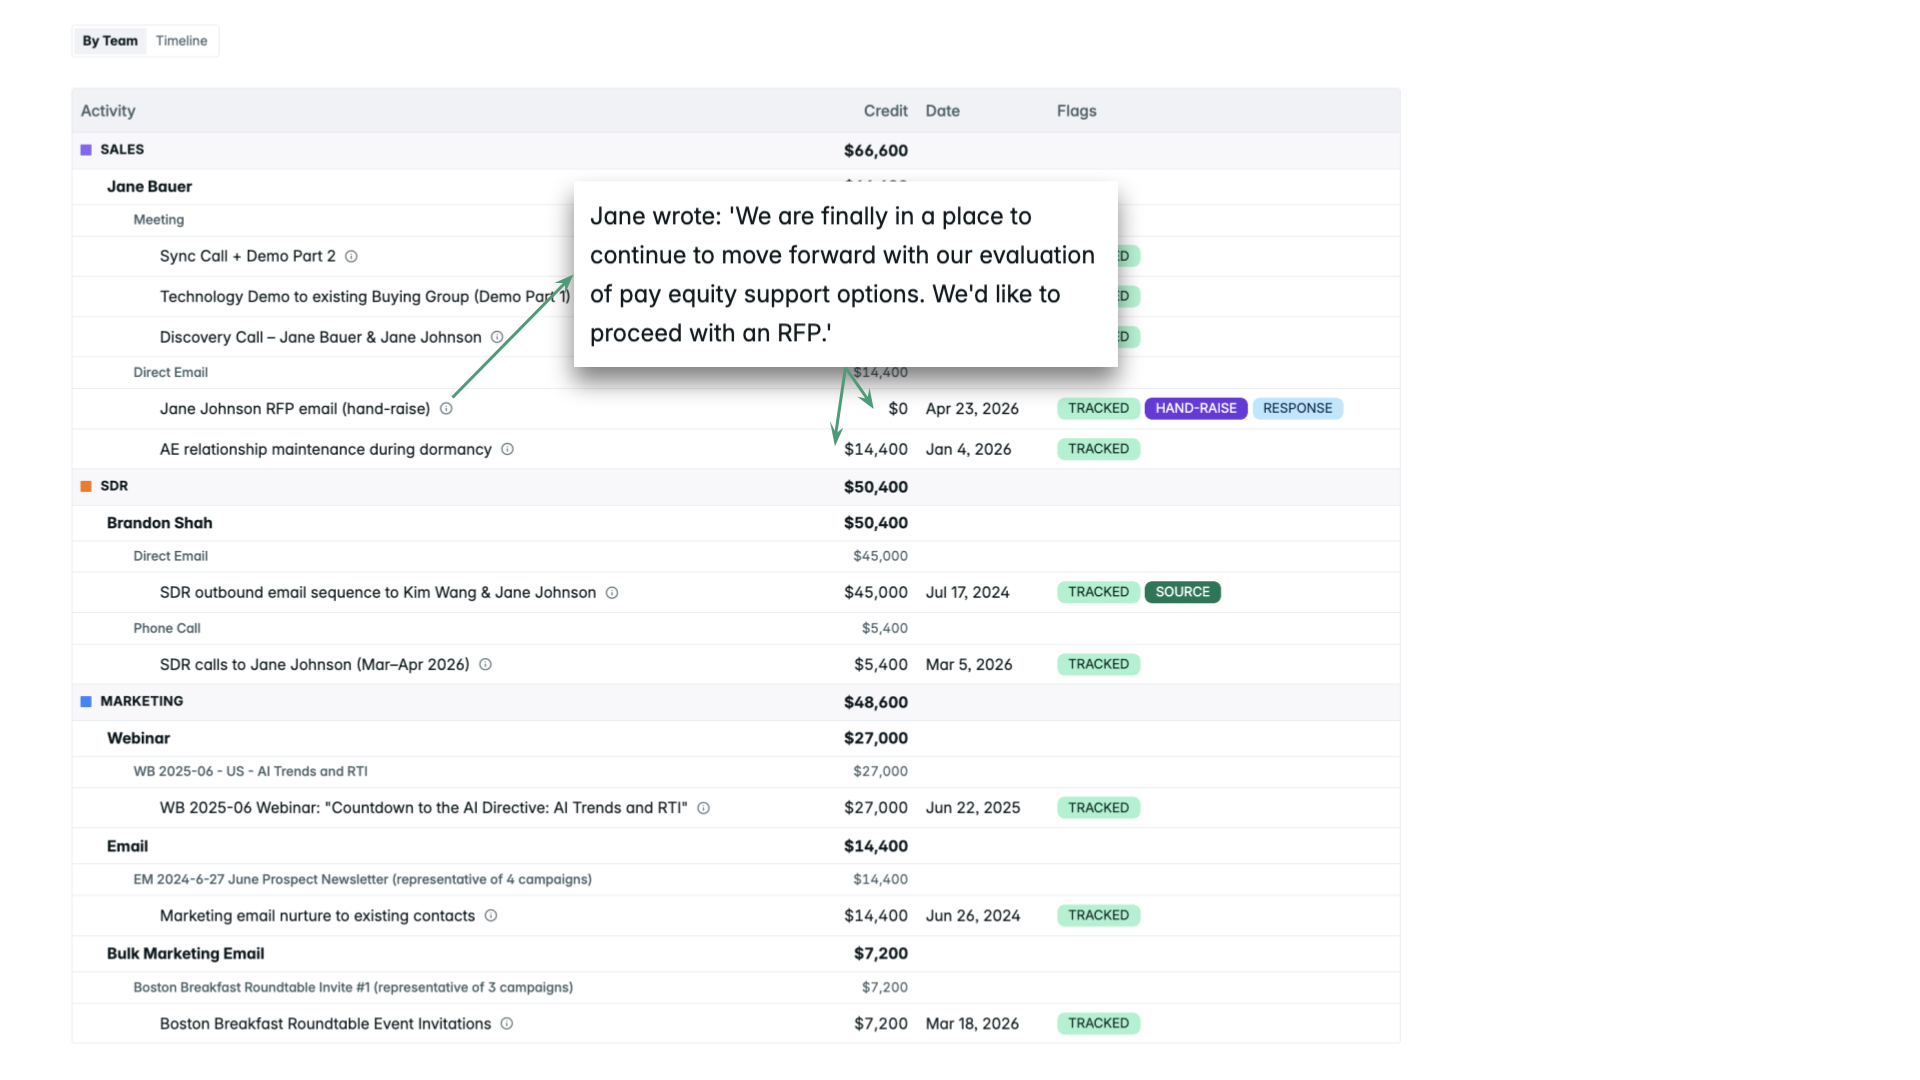
Note the RFP email flagged HAND-RAISE with $0 credit, while the AE’s relationship maintenance during dormancy, the SDR’s 12-month outbound sequence, and the webinar carry the dollars. And every touchpoint, including the $0 ones, carries a reasoning trace exposed in the UI, so when someone asks “why did the chatbot get nothing but the chatbot campaign get credit,” the answer is right there.
The causal chain reads like a deal post-mortem written by someone with perfect memory: persistent SDR outreach → webinar attendance → post-webinar follow-up → discovery and demos → budget dormancy → relationship maintenance → buyer re-initiates RFP. Then everything rolls up across the portfolio by team, channel, campaign, and salesperson, which is where it starts looking like a normal attribution dashboard, except the numbers underneath are built from evidence instead of curve positions.
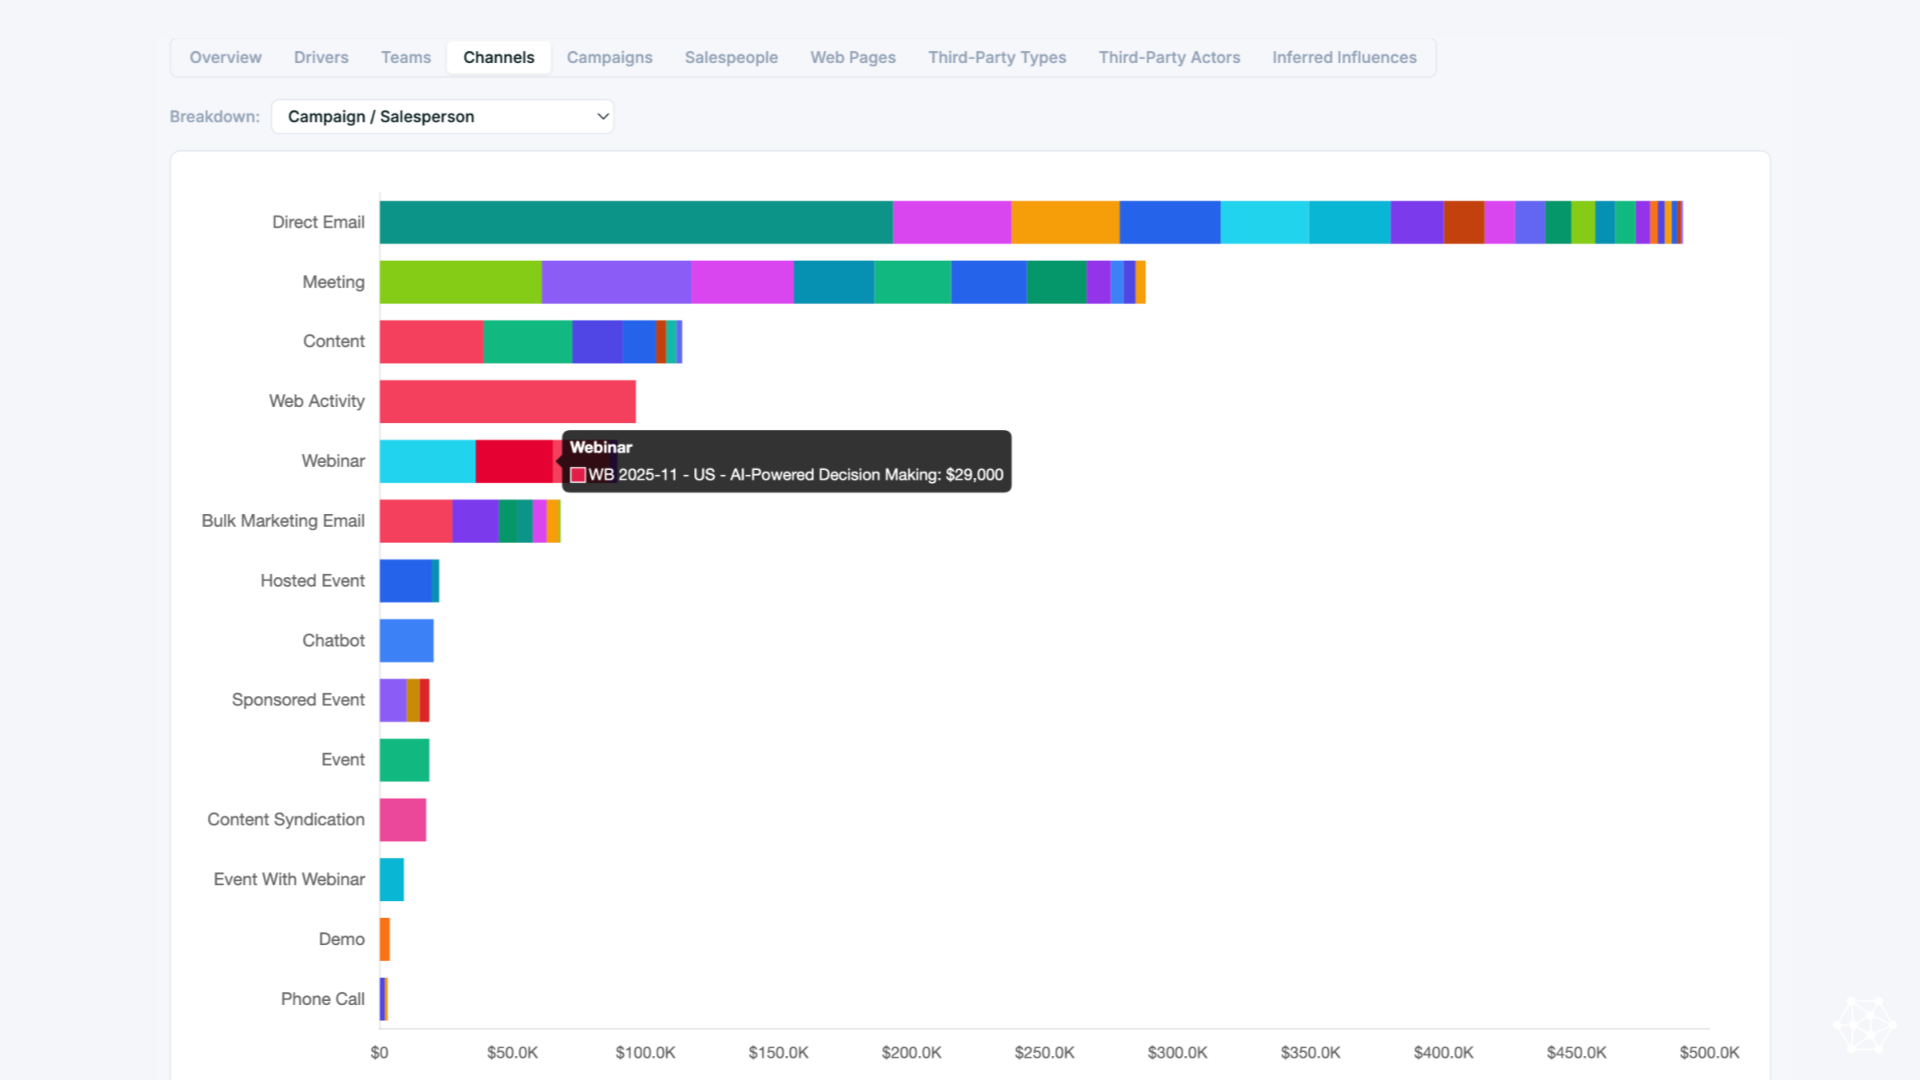
For the times when leadership does want the ONE thing that got the deal, our model also allows you to see the one activity that got this deal moving, and run aggregate reporting using that model as well.
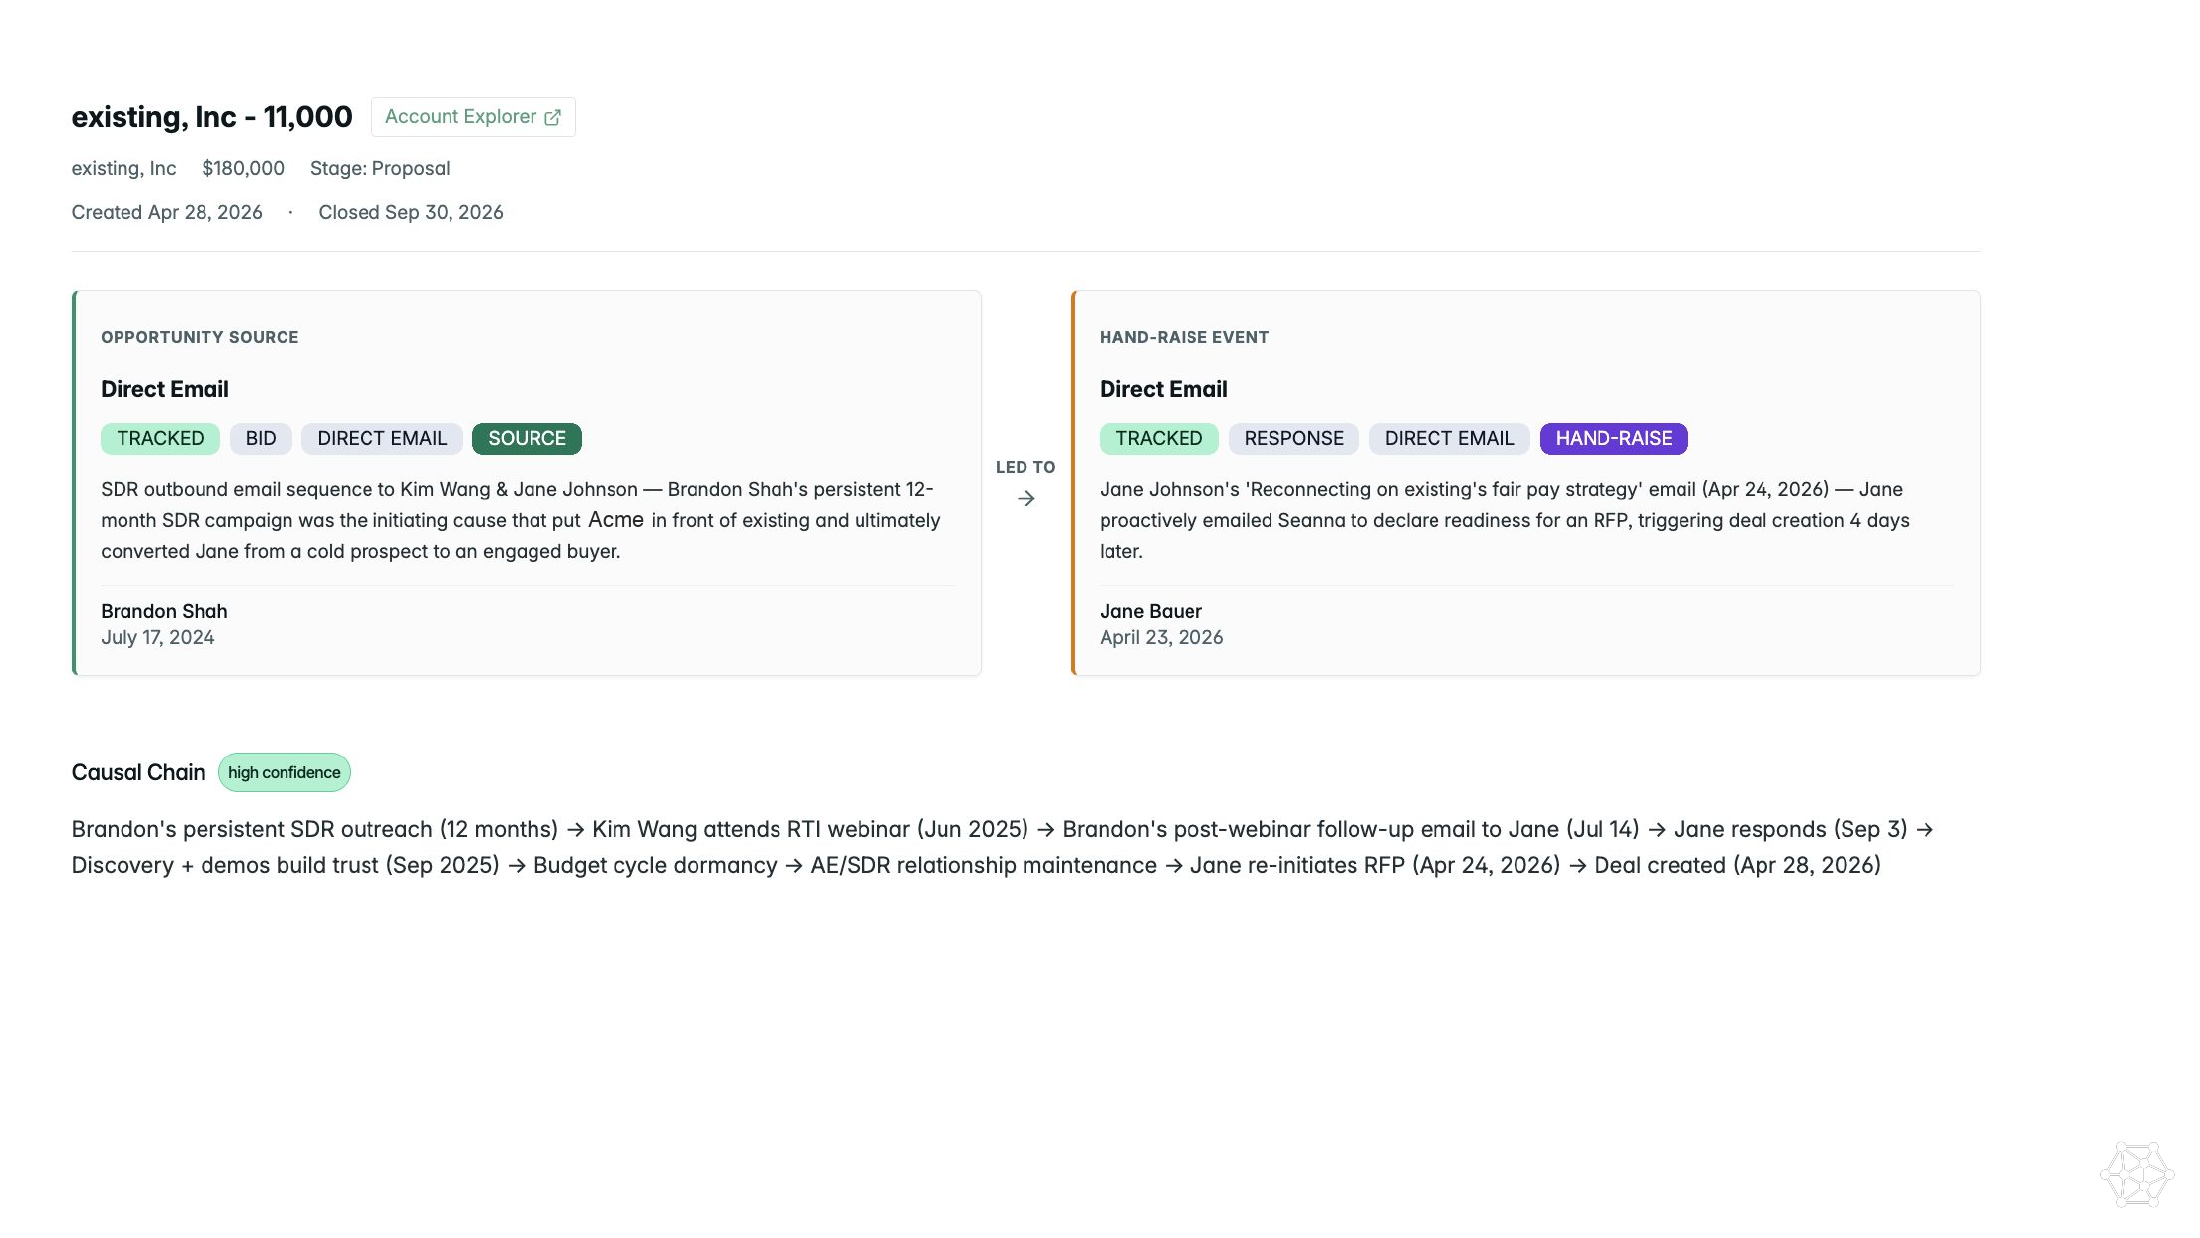
The interesting part is that this approach finds sources that were thought impossible to detect: “there is no way your model can tell this deal came through an alumni network.” It could. Someone had mentioned it on a call, the analyst extracted it, and it survived the judge.
This is not the only model
While we believe this approach outputs the most accurate results in zero-sum B2B attribution, we also know it has its limitations. This is one way to approach attribution powered by a clean and unified data layer, but the possibilities in what you can build to measure are endless. Examples of other types of measurement our customers built on top of Upside data can be found in our miniapp library.
Limitations
- It’s expensive and slow. Three to seven Opus-tier agents at up to an hour each, per deal. This works because B2B deal counts are small (the same fact that killed statistical models makes agent reasoning affordable). If you have 50,000 small deals a quarter, this architecture is not for you.
- No immediate signals. This is the type of model you run once the deal is closed to help you understand where to invest, not something that gives you short-term signal on whether a campaign or tactic is working. Metrics like influence or number of opportunities created post engagement are better measurements for that type of attribution.
- It needs a clean data layer. Two years of identity resolution and extraction work is doing a lot of lifting here. Pointed at a raw CRM export, the analyst might struggle to make sense of duplicate identities, accounts, and the rest.
- The full reasoning is extensive. Each touchpoint’s trace is exposed in the UI, but the complete analysis runs many pages and nobody consuming a marketing report wants that. We’re still figuring out the right way to surface it.
We packaged the whole orchestration layer as a product called Pipedash, and the underlying data layer is queryable if you’d rather build your own version of this on top. Alex and I did a full webinar walkthrough with live examples if you want the video version. And yes, if you submit a demo request after reading this, the form itself will get 0% credit in our system. This blog post will get it instead.